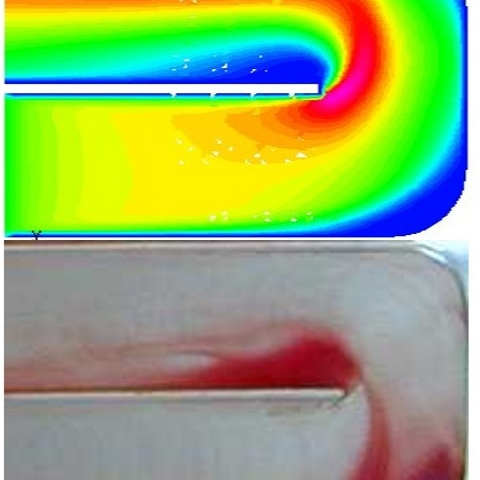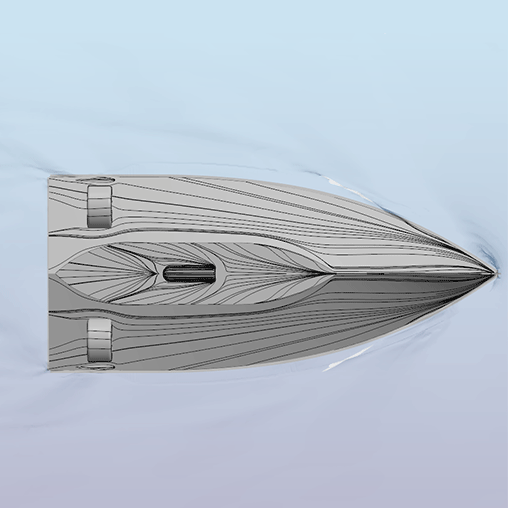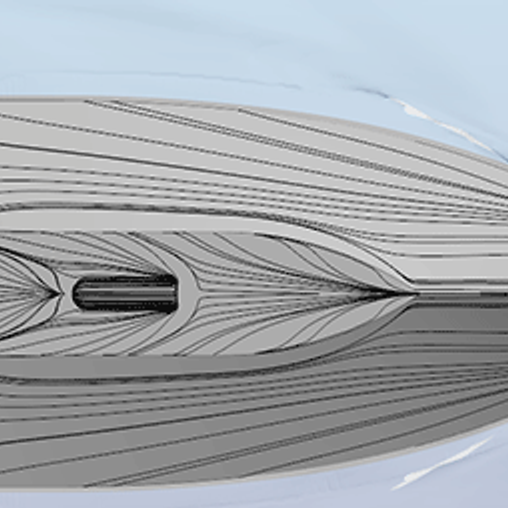

simulating capillary-driven flow.
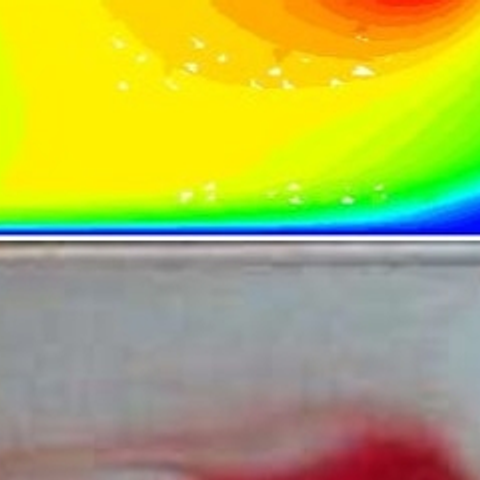
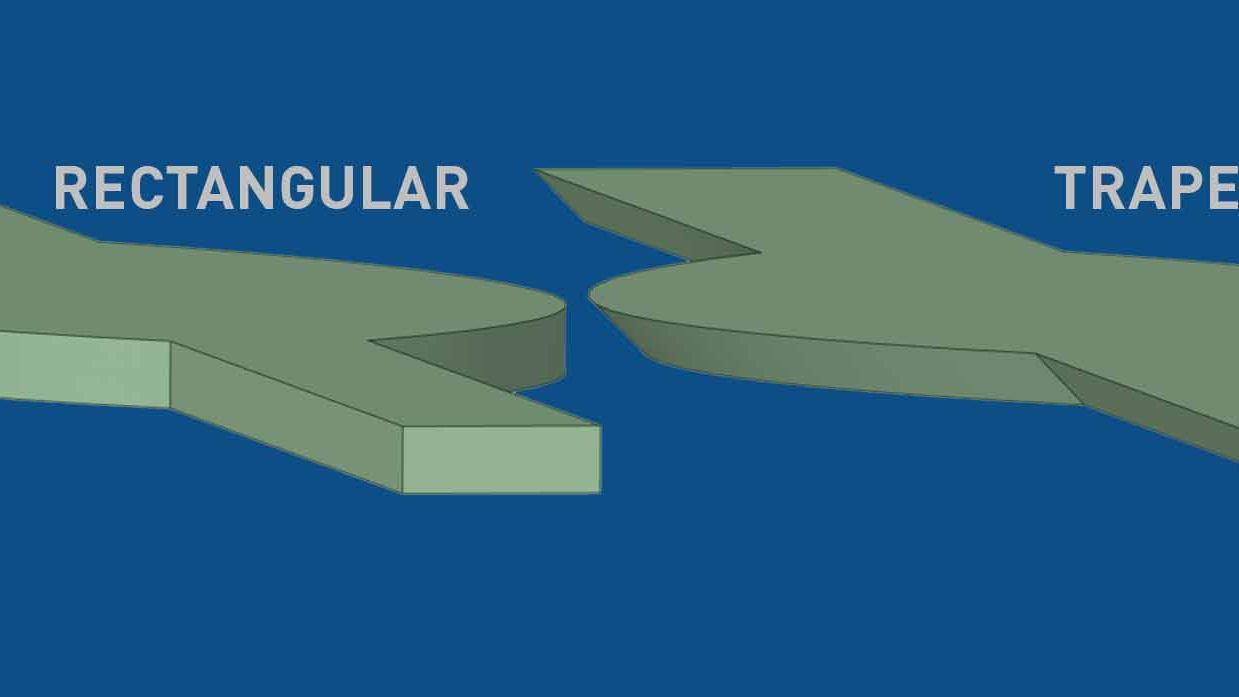
A multiphase CFD simulation is set up using the Volume of Fluid (VoF) method. Two phases were defined: a liquid phase (water) and a gas phase (air) at room temperature, with a surface tension between the phases. The flow is capillary-driven, which means that no driving pressure or velocity is defined at the boundaries. Instead, a wetting contact angle between the liquid and the wall is required to enable the liquid to slowly creep along the wall. This contact angle at the bottom and side walls is set to 60 degrees, while the top wall contact angle is set to 90 degrees. At the start of the simulation the microfluidic channel is filled with air and the adhesion force causes the channel to slowly fill up, as seen in figure 2.
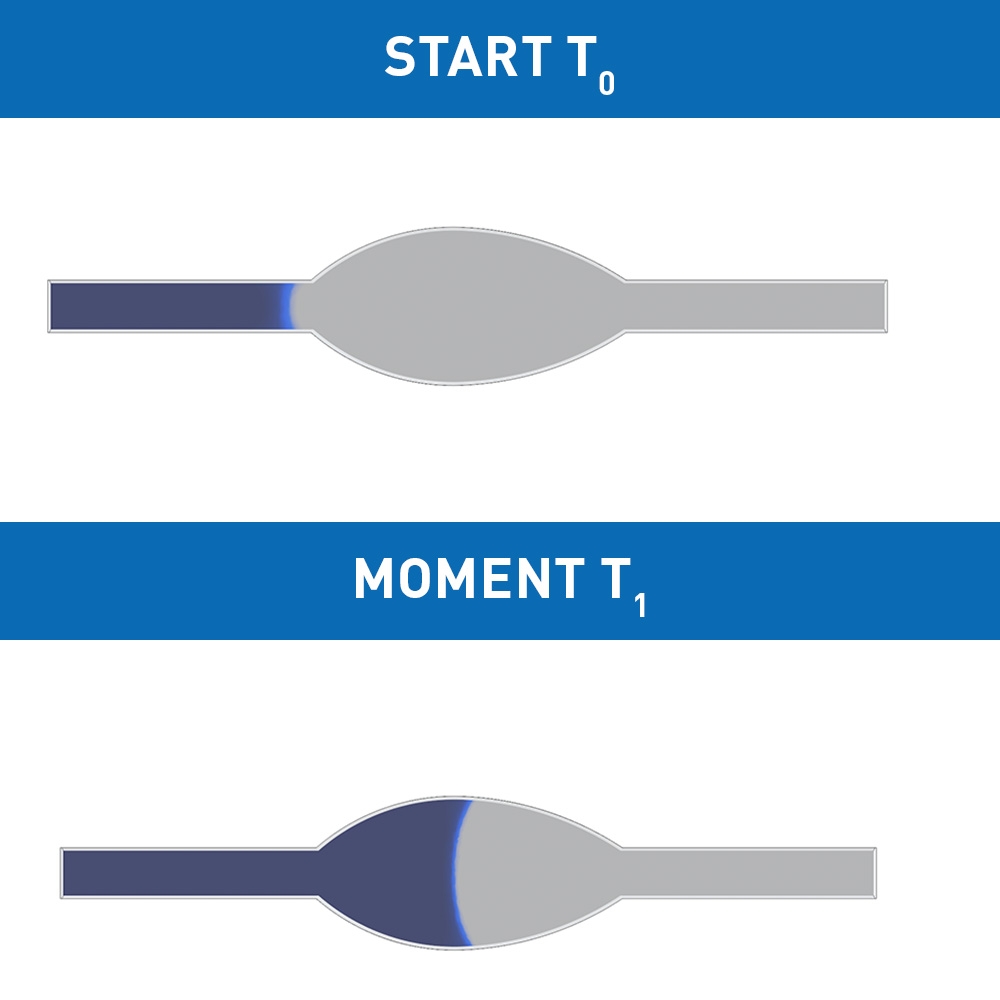
The meniscus is the curved interface between the liquid and gas phases that arises due to the contact angle at the wall. By recording the average position of the meniscus over time for two designs and plotting the results, a comparison can be made between the filling times of the two designs.
capillary pressure vs hydraulic resistance.
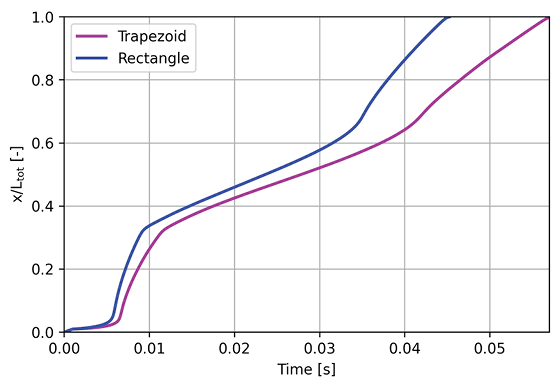
The meniscus is tracked over time to compare the filling time of the two designs. Figure 3 shows a plot with the normalized position of the meniscus as a function of time. It can be observed that the rectangular cross-section fills up to the end of the channel (Ltot) faster than the trapezoidal channel. To better understand the faster filling time of the rectangular shaped microfluidic channel, the competition between the capillary pressure and hydraulic resistance is more closely examined.
The capillary pressure in a microchannel is described by the Young-LaPlace equation, see equation 1. The radius of the curvature of the meniscus is straightforward for circular channels, but for rectangular or trapezoidal it is not trivial. A practical approximation for the curvature radius would be the hydraulic diameter. This length scale is commonly used for non-circular tubes and channels. The formula for this diameter is stated in equation 2. The hydraulic diameter and the curvature of the meniscus are closely related as one can imagine. A smaller hydraulic diameter results in a smaller meniscus radius and thus a larger capillary pressure; and vice versa.
∆P = γ•1/R (eq. 1)
with ∆P pressure drop [Pa], γ surface tension [Pa•m] and R radius of meniscus curvature [m].
Dh = 4A/P´ (eq. 2)
with Dh hydraulic diameter [m], A cross sectional area [m2] and P´ perimeter [m].
During the simulation, the area and perimeter of the liquid-gas interface was recorded to calculate the hydraulic diameter. The hydraulic diameter changes over time due to change in shape of the channel, but only the minimum and maximum values are listed in the table. The values in the table clearly indicate that the hydraulic diameter of the trapezoidal shaped channel is smaller at every moment in time during filling. Consequently, the capillary pressure is the highest and a faster filling can be expected. It is important to note that this represents only one aspect of the interplay between capillary pressure and hydraulic resistance.
Minimum Dh [mm] | Maximum Dh [mm] | Rh [Pa·s/m3] | |
|---|---|---|---|
| Rectangle | 0.053 | 0.066 | 6.24 • 1012 |
| Trapezoid | 0.044 | 0.051 | 9.77 • 1012 |
Hydraulic resistance is the other parameter at play as mentioned in the paragraph above. The hydraulic resistance of the total channel can be estimated by performing a single phase CFD simulation and recording the flow rate and pressure over the channel. Equation 3 shows the relation between the pressure drop and flow rate. A higher resistance results in a lower flow rate and thus a higher filling time.
∆P = Rh• Q (eq. 3)
with ∆P pressure drop [Pa], Rh the hydraulic resistance [Pa•s/m3] and Q the flow rate [m3/s].
The respective hydraulic resistances for the rectangle and trapezoid are stated in the table. It can be concluded from these values that the hydraulic resistance is the lowest for the rectangular shaped channel. Hence in this competition the rectangular design is the winner.
conclusion.
In conclusion, CFD simulations can be used to determine the filling time of non-trivially shaped microfluidic channels and networks. It is challenging to predict the filling time of a microfluidic channel due to the competition between the capillary pressure and hydraulic resistance. In our comparative study the rectangular cross-section design fills the fastest. Although this design may have a lower capillary pressure, this is offset by its lower hydraulic resistance, resulting in an overall faster filling process.
"all companies great and small"
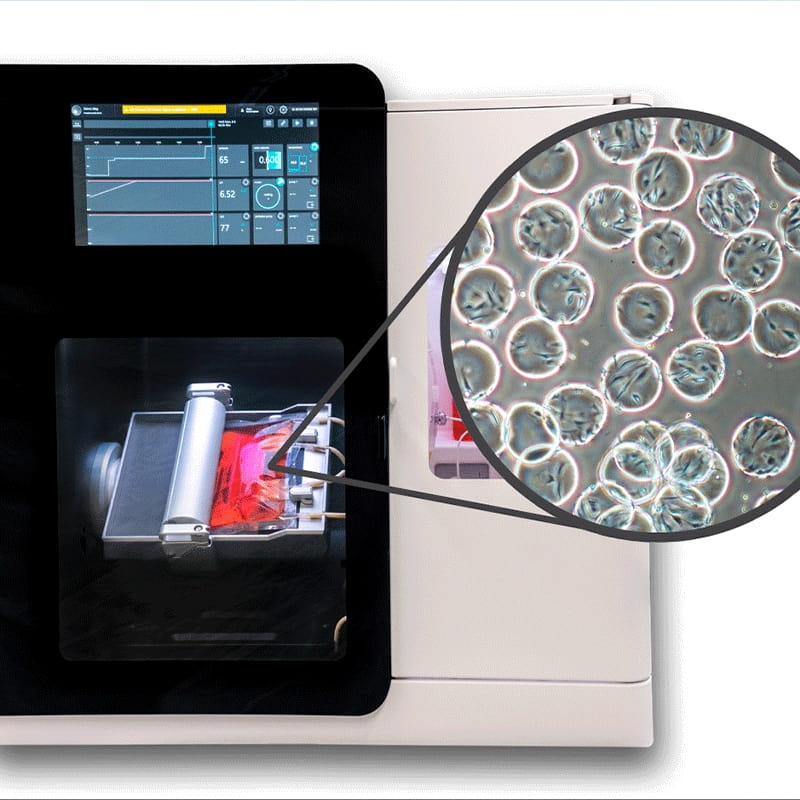
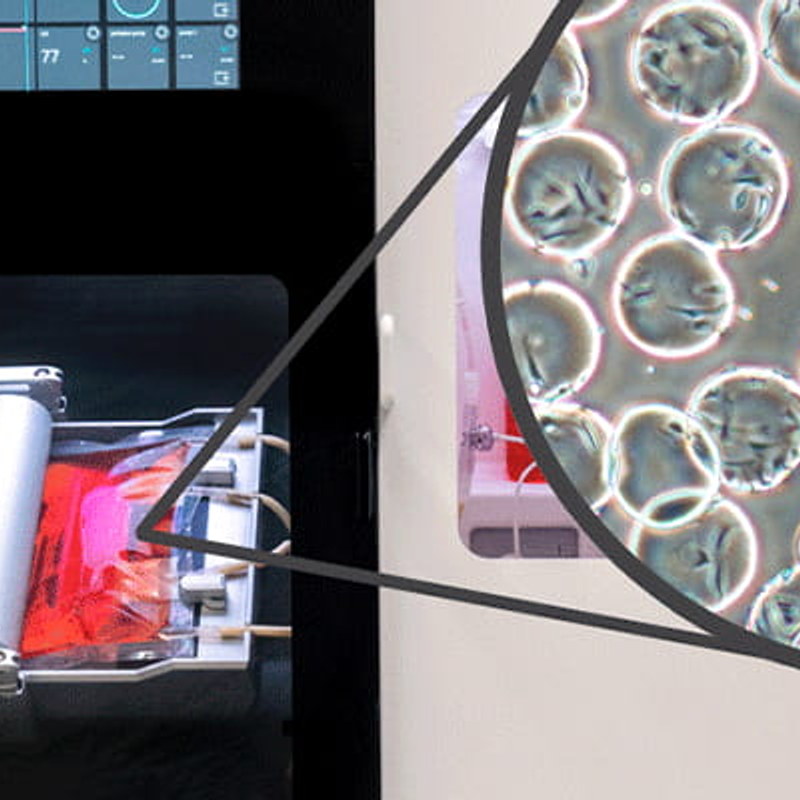
At Demcon multiphysics, the keyword is “multi”. We not only specialize in multiphysics but also in multiscale. This means that we tackle problems at the microscale, macroscale, and anything in between. From microfluidics to engine rooms, small projects consisting of a few questions to large projects with a duration of several years, and clients ranging from sole proprietorships to multinationals. Our experience at these multiple scales allows us to provide tailored solutions to meet the unique needs of each client, regardless of the scale of their project.